
Subways Back on Track in the City
New Yorkers are taking to the subway again. Recent counts show the trains now hit 85% of the levels seen before the pandemic. Even buses are seeing more riders. Whether it’s sunny or rainy, folks choose these rides to get around town.
What’s the update? The numbers tell us transit is making a strong comeback. This matters for everyday commuters and local businesses. Changes like these can boost your morning routine or business foot traffic on the block.
What can you do? Keep an eye on local transit alerts and updates. Use this info to plan your trip and stay ahead when your usual route shifts. We’ll be here with the latest so you know what’s up in your neighborhood.
Data-Driven Overview of MTA Ridership Trends
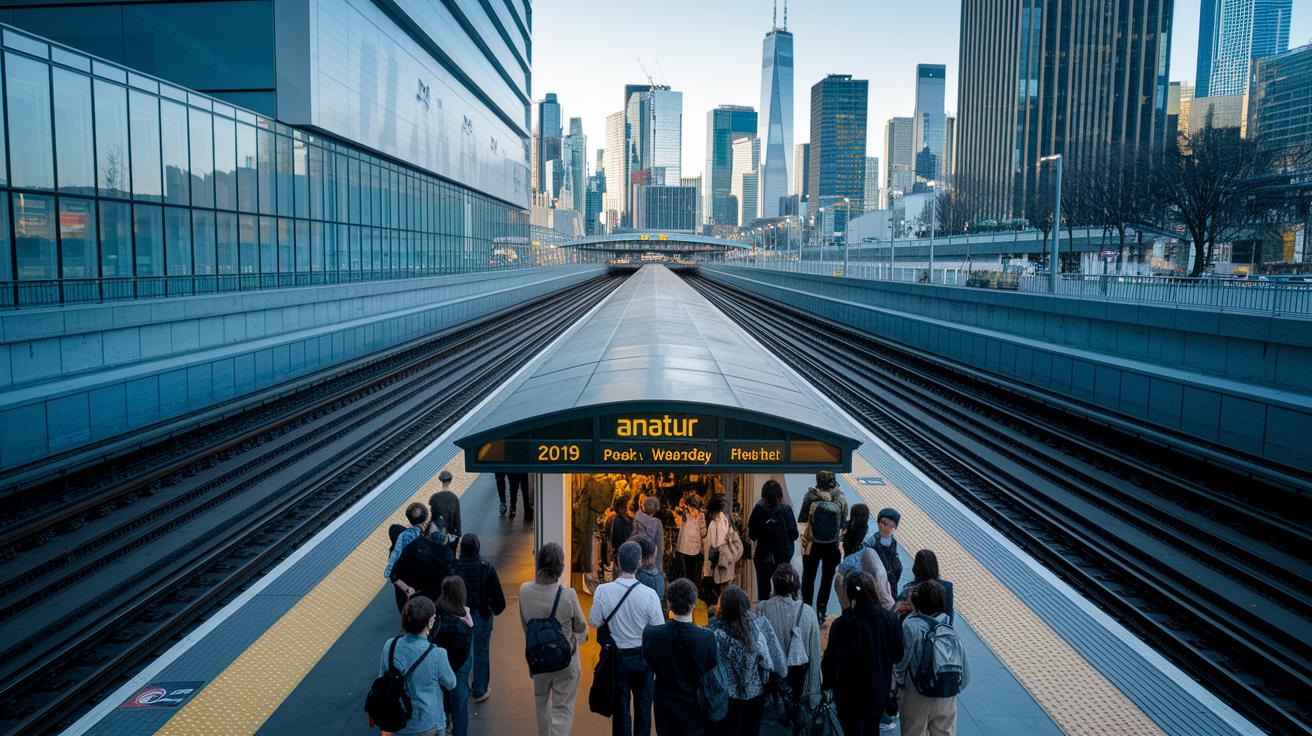
New York City's subway system is bouncing back, with rides now at 85% of pre-pandemic levels. The subway covers over 400 stations and roughly 665 miles of track, serving as a daily lifeline for many New Yorkers. Even bus ridership is up compared to before the pandemic, showing that more people are choosing flexible travel options. Before COVID, many folks depended mostly on the subway. Now, more travelers are taking buses to suit their needs.
Recent stats highlight big changes in travel habits. The subway recently had its busiest weekend day since 2019, pointing to a shift in how and when people ride. Rush hour numbers in the morning and evening are almost back to what they used to be. Data from transit dashboards shows that overall ridership is on the rise. This steady recovery is a good sign for daily commuters and shows that the MTA's improvements are paying off.
Historical Comparison of MTA Ridership Trends Pre- and Post-Pandemic
Between 2019 and 2023, subway ridership went through major ups and downs. In 2019, the system hit its peak with about 5,000,000 entries on a typical weekday. Then COVID-19 hit, and by April 2020, lockdowns and health worries dropped numbers steeply. Over 2021 and 2022, New Yorkers started riding again little by little, and by 2023, the numbers edged closer to where they were before the pandemic.
| Year | Average Weekday Entries | % Change from Previous Year |
|---|---|---|
| 2019 | 5,000,000 | N/A |
| 2020 | 1,250,000 | -75% |
| 2021 | 2,500,000 | +100% |
| 2022 | 4,000,000 | +60% |
| 2023 | 4,750,000 | +18.8% |
These figures tell a clear story. The system saw a sharp drop followed by a steady rebound. Even though the numbers still trail behind the 2019 peak, the upward trend shows that daily travel is slowly getting back to normal. New Yorkers are gradually rebuilding their commuting routines and adapting to new ways of using public transit.
mta ridership trends: Buoyant Data Insights
Morning and evening crowds are bouncing back strong. Data shows both time slots are close to 90% of what they were before the pandemic. The AM rush, when folks head to work, mirrors the PM surge as people return home. This means our usual travel habits are coming back in force.
Weekend travel tells a different story. On five weekends in 2023, ridership even exceeded weekday numbers. Think of it like your neighborhood diner getting busier on the weekends than on a regular workday. This change might push transit to tweak services on quieter days to keep up with the demand.
Impact of Congestion Pricing and Policy Shifts on MTA Ridership Trends
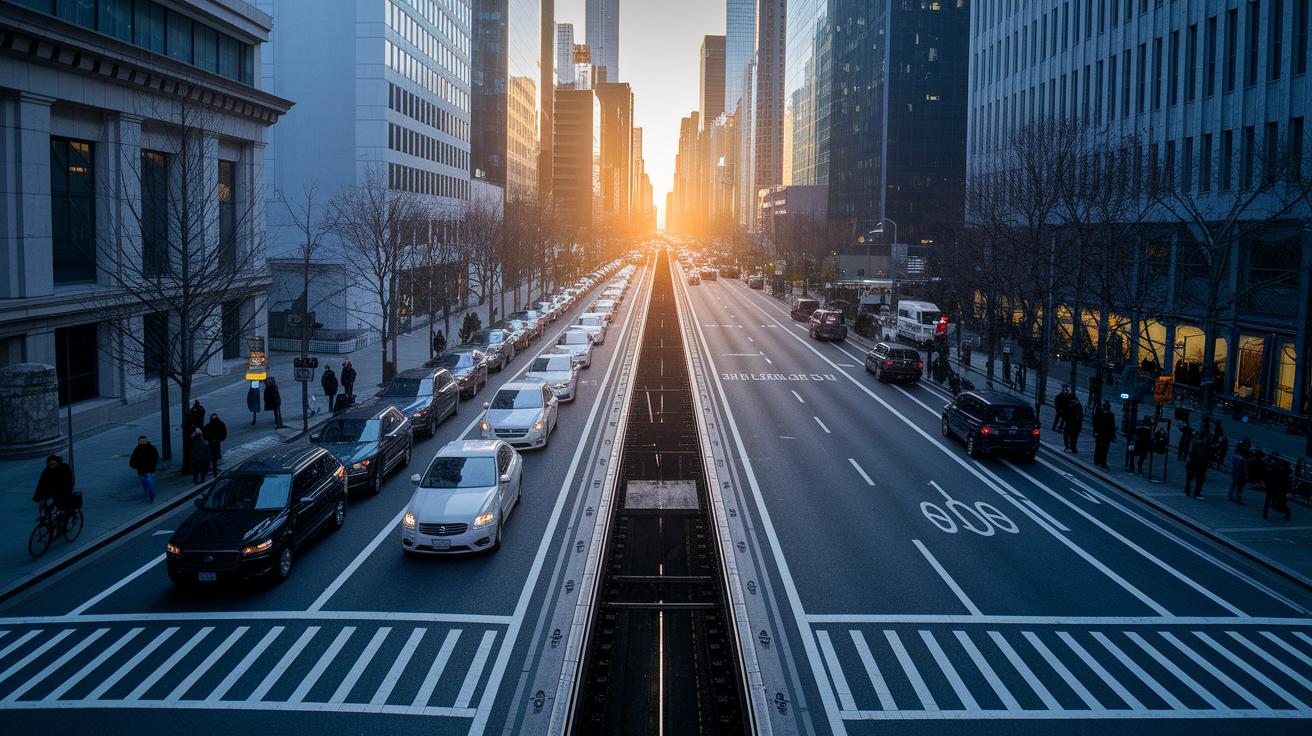
Congestion pricing has made a big difference in Manhattan’s core. Fewer cars are entering the area, 11% less, which means easier traffic flow and more room for other modes of travel. This change helps push drivers toward using the subway or buses, offering a more efficient way to get around.
The plan not only clears the streets but also brings in more cash. It made over $508 million while transit-related crimes dropped by 5.5% compared to last year and are more than 14% lower than before the pandemic. These shifts show that smart pricing can lower congestion costs and boost safety in transit spots.
City officials are keeping an eye on how transportation works as rules change and fare systems improve. Future tweaks may blend more pricing strategies with better service so the transit system stays sharp and ready for New York’s evolving needs. This close link between policy and ridership tells us it’s important to watch these changes as the city adapts.
Technological Advances Shaping MTA Ridership Trends Data
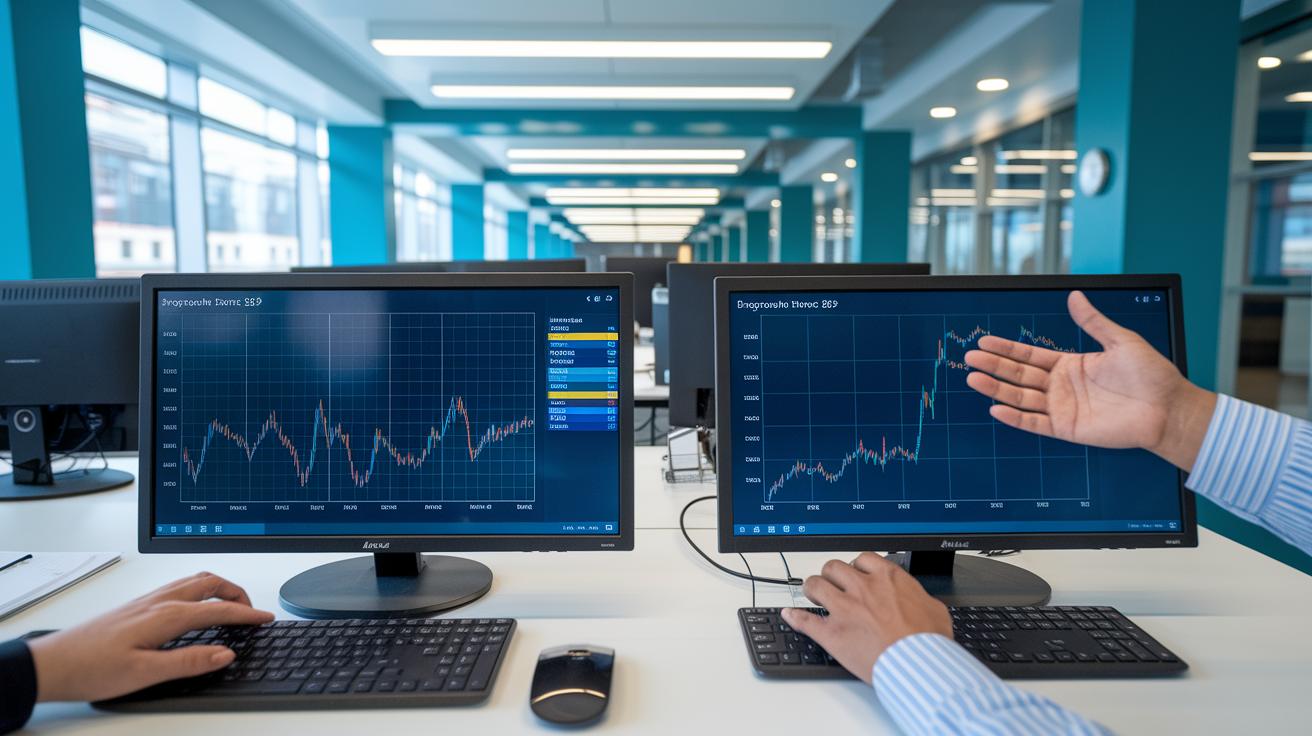
The MTA is using new digital tools to better track the daily patterns of commuters. They now use open-data dashboards built with Power BI and Jupyter Notebooks drawn from official MTA data. These dashboards, similar to those on nyc subway ridership trends, offer almost real-time updates so that transit planners can quickly spot trends and adjust services.
Digital payment systems record fare data at entry points, giving a more accurate rider count. Mobile apps add useful data on how full trains get during peak hours, making it clear which routes need extra attention.
Smart card tracking smooths fare collection and cuts down delays at turnstiles. Together, these tools improve how data is collected and reviewed. They help the MTA make faster, smoother service changes to meet commuter needs.
| Tool | Role |
|---|---|
| Contactless fare payments | Quick and accurate fare collection |
| Real-time passenger counts | Tracks how crowded trains are |
| Mobile app analytics | Monitors train occupancy during rush hours |
| Smart card tracking | Smooths the fare process and cuts delays |
Each of these steps is part of a larger plan that helps transit services keep up with the fast pace of city life, ensuring New Yorkers get reliable rides every day.
Forecasting Future MTA Ridership Trends
MTA analysts are crunching numbers with new curve models to see how riders will bounce back. They look at how service capacity changes and factor in busy travel times, seasonal shifts, and changes in how people commute. Forecasts show that ridership should return to pre-pandemic levels by late 2024. They draw on past records and current trends to paint a detailed picture of transit improvements. This approach helps spot small shifts in commuter habits and shows where service might need a boost or a tweak.
Looking ahead, there are three likely scenarios. One possibility sees a steady climb back to old numbers by the end of 2024. Another shows a slower recovery as commuting habits continue to shift gradually. The third suggests a quicker bounce-back, driven by fast service adjustments and rising demand. Each scenario gives transit officials clear insights to fine-tune schedules, set aside the right resources, and keep service running smooth for New Yorkers as they gradually get back on board.
Data Sources and Methodology Behind MTA Ridership Trends Analysis
Our work uses open-data portal sets from 2020 to today. We also pull data from a public GitHub that stores our Jupyter Notebooks and Power BI reports. We review official MTA numbers closely and document each step. Think of it like a logbook where every update is recorded.
We based our study on four main sources: portal datasets, official MTA reports, our GitHub with Jupyter Notebooks, and the Power BI dashboards. Each source helps us see how busy the service is and check data flow. This clear method keeps our findings accurate and up-to-date while letting anyone follow the trail.
Final Words
In the action, this article examined clear MTA data, from overall network recovery to historical shifts in subway and bus performance. It touched on peak hour changes, policy impacts, and new tech tools that guide everyday commuter decisions. Key figures show subway ridership at 85% of pre-pandemic levels and rising bus numbers. The details give a full glimpse into mta ridership trends. With fresh data and a focus on the community, the outlook stays positive and practical for daily travel.
FAQ
What is MTA daily ridership?
MTA daily ridership reflects the count of riders using the subway system each day. This figure helps track transit demand and measures recovery progress compared to pre-pandemic figures.
How does the MTA ridership dashboard work?
The MTA ridership dashboard compiles real-time data from official sources, showing trends and patterns. It lets commuters stay informed about daily rider changes and overall system performance.
How did NYC subway ridership evolve over the years?
NYC subway ridership evolved significantly, with 2019 serving as the high baseline. After the pandemic drop, gradual recovery trends have been observed, reflecting the system’s return toward pre-pandemic levels.
What is the average ridership of the NYC subway?
The average NYC subway ridership represents typical daily passenger counts. These numbers are derived from official MTA reports, factoring in both peak and off-peak hours to display everyday usage.
Has MTA ridership increased over time?
MTA ridership has seen an increase as more commuters return to transit after the pandemic. Recent data shows that ridership is nearing pre-pandemic levels in many service areas.
What factors have led to a decline in public transit ridership in the United States?
Public transit ridership declined largely due to shifts such as heightened remote work, reduced travel during the pandemic, and changing commuting habits, as confirmed by national transportation studies.
Is the MTA making money?
The MTA collects revenue through rider fares and other services, though expenses often balance income. Financial reports show that while revenue streams are solid, operational costs remain a significant factor.
What services fall under the MTA’s management?
The MTA manages more than just subways; it oversees New York City Transit, Regional Bus Operations, Long Island Rail Road, Metro-North Railroad, and bridges and tunnels, providing a full range of transit options.
How does NYC bus ridership compare to subway ridership?
NYC bus ridership now accounts for a large number of daily commuters and in some cases has exceeded pre-pandemic numbers. This growth reflects changing commuter patterns across various transit modes.
How is MTA subway hourly ridership measured?
MTA subway hourly ridership is measured by tracking passenger counts each hour. This data helps identify peak travel times and supports adjustments in service to better meet commuter demand.