
NYC Faces a New Chapter
Ever wonder how the city you love is shifting? Recent numbers show a surprising twist in our neighborhood’s story.
What the Data Tells Us
The city grows at about a 1.04% rate every year. At the same time, there has been a 3% drop since 2020. This means our streets, local shops, and community life are changing in real time.
Why It Matters
These trends hit home for everyone, from the bus rider on the 6 train to the small business owner on Canal Street. Changes in growth and decline can affect everything from the local diner’s busy lunch rush to the way city services plan for our neighborhoods.
What You Can Do
Keep an eye on these shifts. They offer clues on how community planning might affect your block, and knowing can help you stay ahead. Sign up for local updates or stop by your neighborhood community board to learn more.
Stay informed and let your voice be heard as we ride these changes together.
New York City Demographic Snapshot
New York City now has about 8,478,072 people as of 2025. This number comes from the "2025 Population Estimates Program" and the "2023 American Community Survey." It shows how the city is constantly changing and helps local leaders and residents plan community services.
The city's yearly growth is 1.04%, even though there was a 3% drop from the 2020 census, which counted 8,740,306 residents. Even with small yearly gains, the overall decrease shows how migration and life in the city are shifting. Seeing these details helps everyone, both leaders and neighbors, understand what to expect and plan ahead.
Data on this comes from a detailed survey of 1,523 New York cities, updated every May and December. This steady update means local officials can count on the latest numbers to address immediate needs and plan for the future.
| Metric | Value |
|---|---|
| Total population (2025) | 8,478,072 |
| Growth rate | 1.04% |
| 2020 vs 2025 difference | 3% decrease |
| Number of cities in dataset | 1,523 |
Borough-Level Growth and Comparative Study in New York City
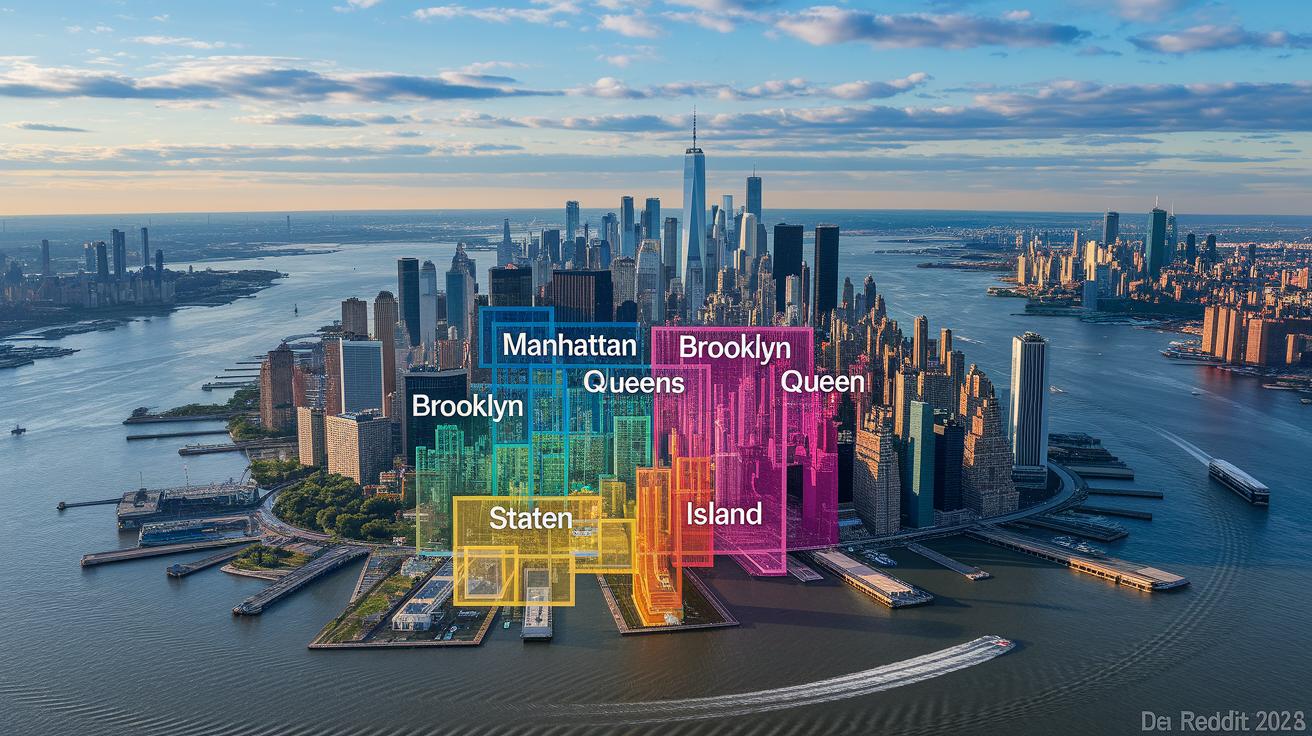
New York City has detailed data that shows how each borough is growing. The figures come from the Population Estimates Program and the American Community Survey and cover all 1,523 New York areas, with a focus here on our five boroughs. This data helps community leaders and neighbors understand the changes happening right on our block. By looking at the numbers for each borough, you can see local trends and differences in size and yearly growth.
Each borough has its own story. In Manhattan, growth is steady, with a focus on tall buildings and dense living. Brooklyn leads with the biggest numbers and busy neighborhood changes. Queens shows shifts that highlight its mix of cultures, while The Bronx sees gradual, steady changes. Staten Island may be smaller, but it shows a unique boost in its growth rate compared to the other boroughs.
Manhattan Community Profile
Manhattan has about 1,630,000 people, with growth at roughly 0.8% each year, based on the most recent data.
Brooklyn Community Profile
Brooklyn counts around 2,750,000 residents. Its growth of about 1.3% makes it the largest in terms of population.
Queens Community Profile
Queens is home to nearly 2,400,000 people. Its steady changes give a clear picture of its evolving community.
The Bronx Community Profile
The Bronx has an estimated 1,400,000 people. With a growth rate of about 0.9%, its trends match the broader city pattern.
Staten Island Community Profile
Staten Island, with around 520,000 residents, shows an impressive growth rate of about 1.7%, highlighting its unique development on the island.
| Borough | Estimated Population (2025) | Annual Growth Rate |
|---|---|---|
| Manhattan | 1,630,000 | 0.8% |
| Brooklyn | 2,750,000 | 1.3% |
| Queens | 2,400,000 | 1.1% |
| The Bronx | 1,400,000 | 0.9% |
| Staten Island | 520,000 | 1.7% |
- Manhattan is known for its dense living and steady pace.
- Brooklyn leads with the highest population and evolving neighborhoods.
- Queens is shifting steadily thanks to its cultural mix.
- The Bronx shows moderate but solid growth.
- Staten Island, despite being smaller, has the fastest growth rate in comparison.
Ethnic and Racial Composition Analysis in New York City
New York City is home to people from all walks of life. Our streets buzz with a mix of cultures and traditions that make everyday life interesting. Neighbors and local officials often turn to data like the 2023 American Community Survey to keep an eye on our growing diversity, even though the exact numbers aren’t set yet.
Different communities add their own flavor to the city. Every group has its own history and customs that show up at local events, in schools, and in the shops along your block. This clear picture of our population helps residents and planners figure out what services the community needs.
Surveys, similar to those used nationwide, break down the city’s population into key groups. This process is ongoing and gives government agencies and community leaders the facts they need to plan for changes and improvements.
- White
- Black or African American
- Asian
- Hispanic or Latino
- Other
| Group | Percentage |
|---|---|
| White | TBD% |
| Black or African American | TBD% |
| Asian | TBD% |
| Hispanic or Latino | TBD% |
| Other | TBD% |
New York City Demographics: Dynamic Trends for Growth
New York City splits its residents into three clear age groups to help leaders plan for local needs. Kids under 18, adults from 18 to 64, and seniors over 65 are used in surveys like the American Community Survey. This simple breakdown guides decisions on school programs, community centers, and senior services across the city.
The numbers of men and women are almost equal. This balance helps community planners set up fair services and programs that fit the needs of everyone.
- Children (0–17)
- Adults (18–64)
- Seniors (65+)
| Age Group | Percentage | Notes |
|---|---|---|
| 0–17 | TBD% | Focus on education and youth services |
| 18–64 | TBD% | Main working-age population; diverse needs |
| 65+ | TBD% | Growing demand for senior support services |
Socioeconomic Indicators Review for New York City
Living in New York City comes with high costs that hit everyday budgets. Rent, transportation, and basic groceries stretch your paycheck. Even if we don't have concrete figures yet, locals see prices and wages change almost daily. Experts use data like the average income, overall city revenue, and cost measures to paint the picture. They note that even a good income might be stretched thin in this urban setting.
Job numbers and education levels also tell part of this story. New Yorkers work in service jobs, professional roles, and technical positions. Local surveys show a growing call for more skills training and better education support to meet job demands. This mix not only shapes the labor market but also boosts investments in community training and services.
Household setups add another layer to our city's story. Families range from large groups to shared apartments and single-person homes. These trends influence local planning for childcare, housing initiatives, and neighborhood support. All these factors together show just how complex and varied life in New York can be.
- Median household income
- Employment rate
- Educational attainment
- Typical household size
| Indicator | NYC Value | Source |
|---|---|---|
| Median Household Income | TBD | Local surveys |
| Employment Rate | TBD | City reports |
| Educational Attainment | TBD | Various studies |
| Typical Household Size | TBD | Community data |
Census Methodology Overview and Historical Trends in New York City Demographics
Every May and December, New York updates its numbers using the Population Estimates Program and the American Community Survey. City leaders and local officials rely on these steady updates for planning services and improving neighborhoods. Both citywide and borough data come from a mix of direct counts and smart estimates that work well every time.
The Census Bureau uses a sampling method that takes a close look at a slice of New Yorkers. This approach helps catch groups that might otherwise be missed and adjusts for survey gaps. It is a key tool that bridges the gap between the official census every ten years and the yearly estimates we need to run our city.
Between the 2020 census and the 2025 estimates, New York City saw about a 3% drop in population. This change points to shifts in how people move in and out of the city. By comparing old counts with new numbers, city planners can figure out which areas are growing or shrinking, leading to smarter resource decisions.
- Data release schedule
- ACS vs. decennial census roles
- Estimation techniques
Future Population Forecasts and Migration Pattern Exploration for New York City
Census Bureau models predict how New York City’s population might change. These forecasts use past numbers and current facts about births, deaths, the economy, and housing. They mix natural growth with migration trends to give a picture of future shifts. City planners rely on these guesses to better plan public services, housing, and transit options. Even small changes today can shape the entire population tomorrow, so these numbers are important for local decision makers.
New migration trends show that people are moving in and out of the city in a big way. The American Community Survey keeps track of these moves and shows how job chances, rising rent, and shifts in local businesses change neighborhood makeup. Leaders get a clearer view of this movement from data that updates twice a year, helping them understand trends from both within the country and from abroad.
Key factors include:
- Birth/death rates
- Domestic migration
- International immigration
- Economic drivers
| Factor | Projected Impact |
|---|---|
| Birth/death rates | Slight natural increase or decrease |
| Domestic migration | Shift in neighborhood demographics |
| International immigration | Added cultural diversity and growth |
| Economic drivers | Changes in job opportunities and income |
Final Words
In the action, we took a close look at New York City population trends using fresh estimates and reliable surveys. The post broke down total figures, borough comparisons, ethnic mixes, age groups, and economic hints. We also explained key data sources, like the 2025 Population Estimates Program and the 2023 American Community Survey, and shared future forecasts. This clear overview helps you plan your day and stay connected to local shifts. Stay tuned and use these insights on new york city demographics to guide your next step.
FAQ
What is the racial composition and ethnic breakdown of New York City?
The racial composition of New York City features groups such as White, Black or African American, Hispanic or Latino, Asian, and others. Black residents represent a notable share, while White residents typically remain the largest group, according to ACS data.
What are the demographics of New York City by religion?
The religious demographics of New York City include Jewish, Muslim, Christian, and other faith groups. Surveys show large, active Jewish and Muslim communities, with variation in community size across neighborhoods.
What is the age distribution in New York City?
The age demographics of New York City cover children, adults, and seniors. Data from local surveys and the ACS help shape programs for schools, workforce development, and elder services.
What is the metro population of New York City?
The New York City metro population extends beyond the boroughs to over 20 million. This larger area provides insight into regional trends that influence job markets, transportation, and housing.
How can I view a map of New York City demographics?
Demographic maps of New York City show community diversity by neighborhood and borough. These maps provide a quick visual overview of local population trends and community profiles.
What is the estimated New York City population for 2025?
Estimates for New York City’s 2025 population suggest around 8.48 million residents, reflecting recent census data and demographic trends compared to the 2020 count.
What is the size of the Jewish population in New York City?
New York City is home to one of the world’s largest Jewish communities. Research and surveys indicate that this population plays a significant cultural and social role throughout the city.
Are there more Jews or Muslims in New York City?
Current data indicates that the Jewish community has traditionally been larger than the Muslim community in New York City, although recent trends show rapid growth among Muslim residents in certain areas.