
Ever wonder what 30+ million rides a week mean for New York City? Each ride shows a bit more than just a trip, it reveals our daily life. Every transfer tells the story of work routes and essential journeys taken by New Yorkers. When the pandemic hit, these numbers changed fast and highlighted which neighborhoods kept moving. In this post we break down the numbers to show how our subway habits have shifted and what that means for everyone traveling across the city.
Data-Driven Overview of NYC Subway Ridership Trends
The NYC subway system handles over 30 million rides each week for a metro area of 20 million people. Every year, riders take billions of trips, which comes to about 55 rides per person. Here’s an interesting note: while many think one ticket equals one ride, a transfer , like going from Classon Avenue (G) to 1st Ave (L) , can end up counting as more than one ride.
These patterns help us see how New Yorkers move around. People often switch lines and board multiple times to reach their destination, and all those rides add up. Take a look at these key facts:
| Metric | Value |
|---|---|
| Weekly Ridership | 30+ million |
| Annual Trips | Billions |
| Average Rides per Resident | 55 |
Knowing these numbers gives us a clear picture of how riders use the subway. Every transfer plays a key role in the overall count.
nyc subway ridership trends: Inspiring Data Insights
Before 2020, New Yorkers hopped on the subway more and more every day. People used the trains to get to work, school and other parts of the city. The trains kept up with the growing demand, and yearly data showed a clear pattern with regular busy and slow times.
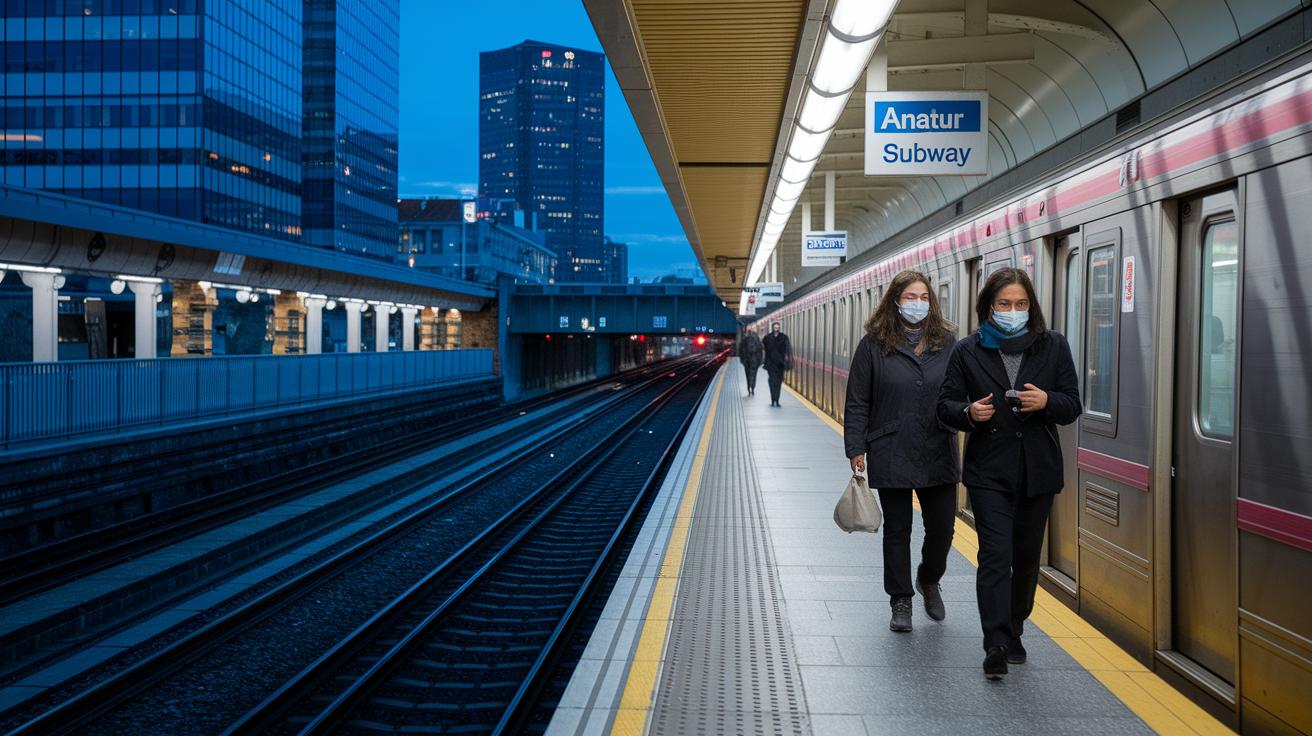
Then in the first half of 2020, COVID-19 hit and things changed fast. Mandatory quarantines led to a drop in subway use by nearly 90%. But this fall was uneven. Some neighborhoods saw the biggest drops, while others still had riders making essential trips. The numbers reveal that those who could work from home did so, while many frontline workers continued riding. This shows that not every New Yorker had the same chance to cut back on travel.
This quick shift in numbers shows just how much our transit system can change with big events. The steep drop during the pandemic raised new questions about how we travel and work in the city. City planners and transit officials are studying these trends to update policies that meet different neighborhood needs. These changes offer clear insights into how a health crisis can impact daily travel in NYC.
Peak Hours and Commuter Patterns in NYC Subway Ridership Trends
At 8 a.m. on a Monday, a ride from Metropolitan/Lorimer perfectly shows the rush-hour pressure. Commuters squeeze into trains to head to work, and real boarding numbers back that up, even if the scene might not look as busy.
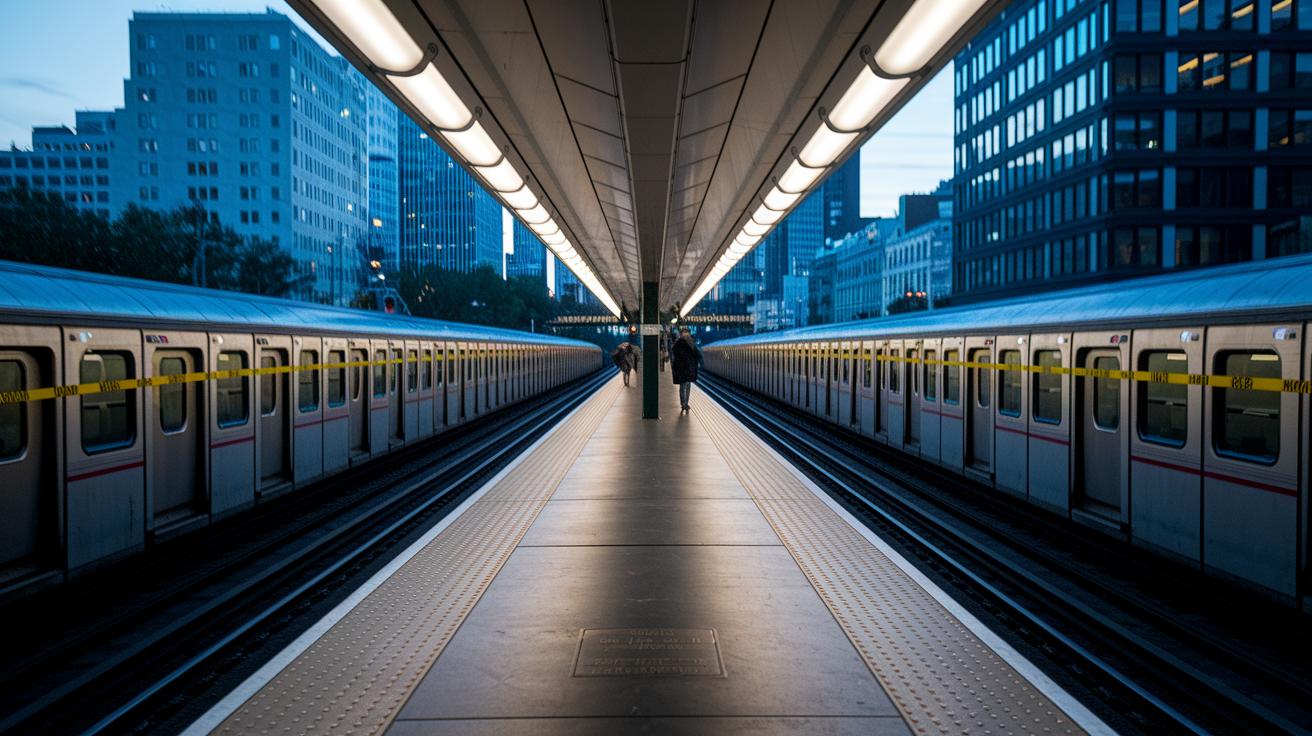
Weekday rush hours have their own beat compared to quieter weekends or late nights. Stations buzz with energy on Monday mornings, while off-peak hours see far fewer trips. Here’s what stands out:
Even though weekends show fewer runs, some lines, like the 5 train, seem less busy on the surface. Data, however, tells us that train schedules and timings can make the busy feel different from what the numbers reveal. As the day goes on, changing commuter routines shape how each station and train line handles the load, clearly outlining New Yorkers’ ever-changing travel habits.
Factors Influencing NYC Subway Ridership Trends
In 2020, public health orders led to a big drop in subway use. Many New Yorkers who could work from home stayed off the trains, while essential workers kept riding. When restrictions hit, subway numbers fell nearly 90%, and once busy corridors were nearly empty.
Debates over fare policies also shape ridership. Some are talking about free-bus ideas to ease crowding and offer more travel choices. At the same time, tight budgets and little spending on bike lanes push some riders to switch from the subway to buses or bikes.
Changes made for safety, like lowering train speeds, affect how timely commutes are. Even small fare hikes or service changes can have a big impact on daily riders. When fare structures or service levels shift, the whole network feels it.
Local funding decisions and regulations continue to shape how New Yorkers get around. Transit planners weigh these factors to adjust services so they better meet the needs of millions of daily commuters.
| Key Factors | Impact |
|---|---|
| Public health measures | Significant drop in riders |
| Fare policy debates | Push for alternative options |
| Budget and infrastructure issues | Shift to buses or bikes |
| Safety and economic changes | Noticeable impact on commute speeds |
NYC Subway Ridership Trends: Inspiring Data Insights
Stop-level boarding counts and train schedules show how each subway line really works for New Yorkers. For example, experts say shutting down the A train would cause 3.4 times the travel disruption compared to closing the G train. That tells us not all lines are equally important.
Weekend and late-night services often run on shorter schedules. The 5 train, for instance, has fewer runs during these times. When service picks up again, key stops see a big crowd despite fewer trips earlier. Checking actual numbers like these helps spot hidden snags in our rail system.
City planners and transit officials review these crowd numbers to see which stops get hit hardest at different times. They match up boarding counts with train frequencies to figure out where extra service might be needed. This kind of work gives useful insights into how our subway holds up day to day.
| Line | Mobility Impact (Shutdown Disruption Ratio) |
|---|---|
| A Train | 3.4x higher disruption |
| G Train | Baseline impact |
Breaking down these boarding patterns and congestion levels helps set the stage for making smart choices about the subway’s future.
Forecasting Future NYC Subway Ridership Trends
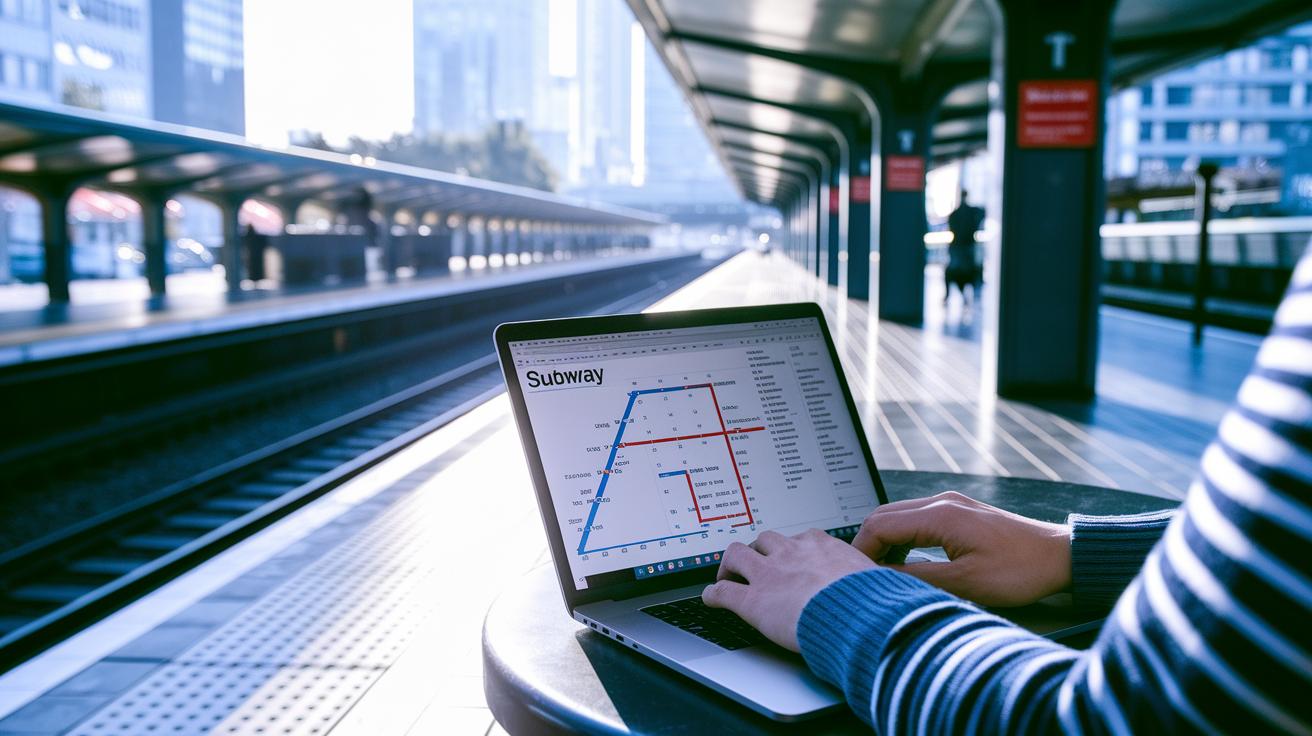
Two MTA Open Data feeds power our models to predict city subway ridership up to 2025. We break down the data by each subway line by checking train schedules and capacity. The numbers show that growing demand will soon stretch the current setup and call for smart upgrades.
We mix old data with live numbers to get a clear picture of what’s ahead. One model tracks each line to see which ones will get the heaviest loads. By using simple system checks, we can guess crowd levels and spot where changes are needed right away.
Our analysis also looks at busy weekdays, seasonal shifts, and planned maintenance times. All this thorough data from the MTA makes our estimates sharper, helping transit planners make smart choices. Picture a Monday morning at 8:00 a.m., when a rush of riders hints that the crowd will only get bigger.
The models point to a future where the subway system needs more capacity to keep up with rising demand. This means transit planners must focus on boosting services and investing in upgrades because our current resources will soon need extra support.
Final Words
In the action, we saw how data paints a clear picture of nyc subway ridership trends from baseline metrics to forecast models. We reviewed how historical shifts, peak-hour patterns, and fare policies weave together our daily transit story.
Each section offered practical insights into how ridership changes impact our community's daily commute and local decisions. This exploration leaves us with a clear view of what lies ahead, lighting the way for smarter travel choices and a vibrant city life.
FAQ
How has NYC subway ridership changed over recent years, including 2019?
The NYC subway ridership shows yearly shifts. For instance, 2019 had robust numbers before the COVID impacts reduced trips significantly, reflecting billions of annual boardings across the system.
What are the daily subway figures and MTA daily ridership counts?
Daily counts reveal hundreds of thousands of boardings on average. These figures peak during rush hours and adjust based on weekday or weekend schedules, offering a clear view of commuter flows.
How is MTA overall ridership measured and where can I view the data dashboard?
MTA ridership is tracked using a mix of boarding counts and service data. The MTA dashboard provides up-to-date, detailed metrics on subway and other transit usage throughout NYC.
What are the key figures for NYC bus ridership?
NYC bus ridership is measured separately and shows distinct usage trends compared to the subway. These figures help illustrate overall urban transit activity and inform service planning.
Which subway line records the highest ridership in NYC?
Analysis indicates that certain lines consistently attract the highest numbers during peak travel times, making them the busiest routes in NYC and essential for handling the bulk of commuter traffic.